What is SoundMap?
In 2011, the U.S. National Oceanic and Atmospheric Administration (NOAA) convened a working group to develop tools to map the contribution of human sound sources to underwater ocean noise in U.S. waters. This Sound Mapping (SoundMap) working group was established alongside the Cetacean Mapping (CetMap) working group. Together, the development of these two mapping tools comprised the Cetaceans and Sound (CetSound) effort.
The specific objective of the NOAA Underwater Sound Field Mapping Working Group (SoundMap) was to apply mapping methods to depict temporal, spatial, and spectral characteristics of underwater noise resulting from multiple human activities. These tools used environmental descriptors and the distribution, density, and acoustic characteristics of human activities within U.S. waters to develop first-order estimates of their contribution to ambient noise levels at multiple frequencies, depths and spatial/temporal scales.
Long-term, Chronic Noise
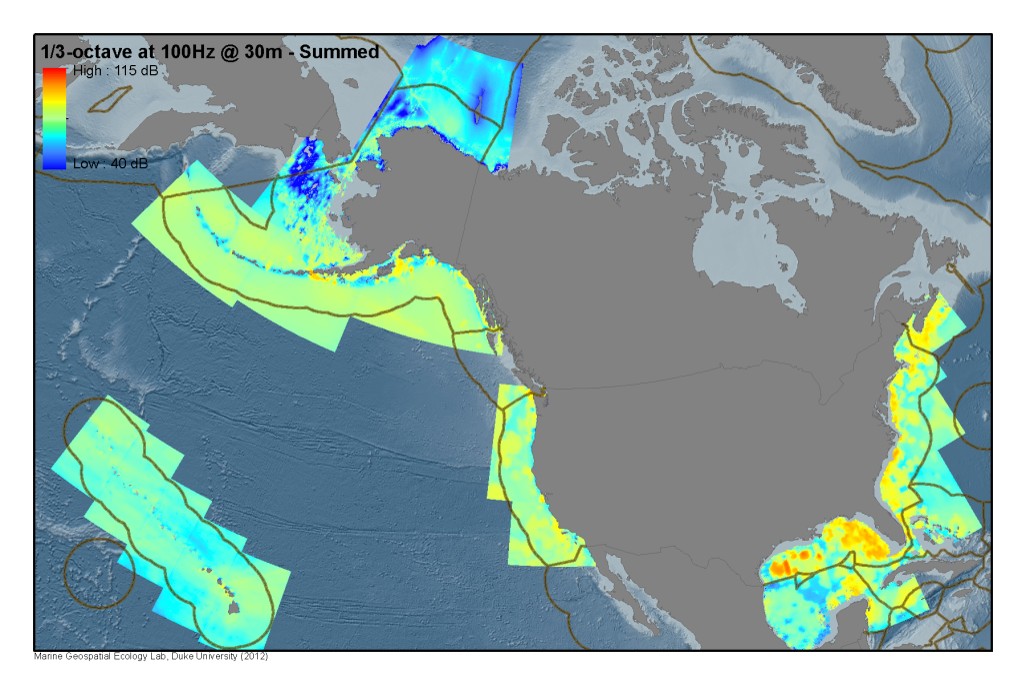
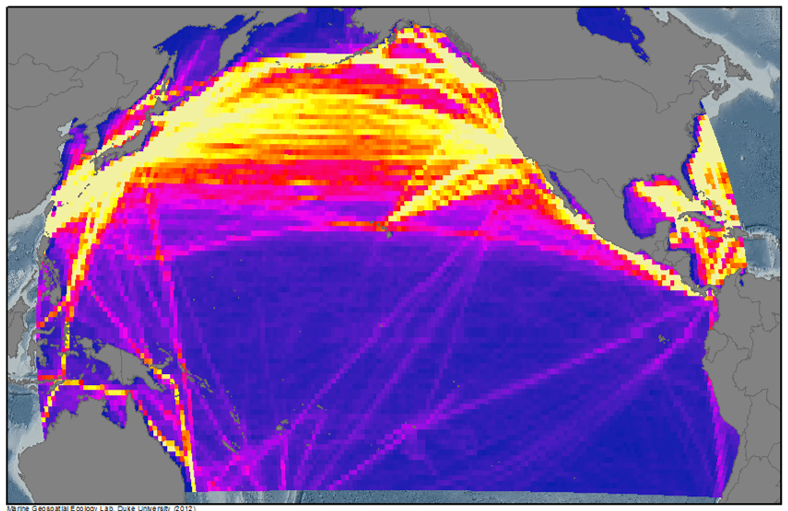
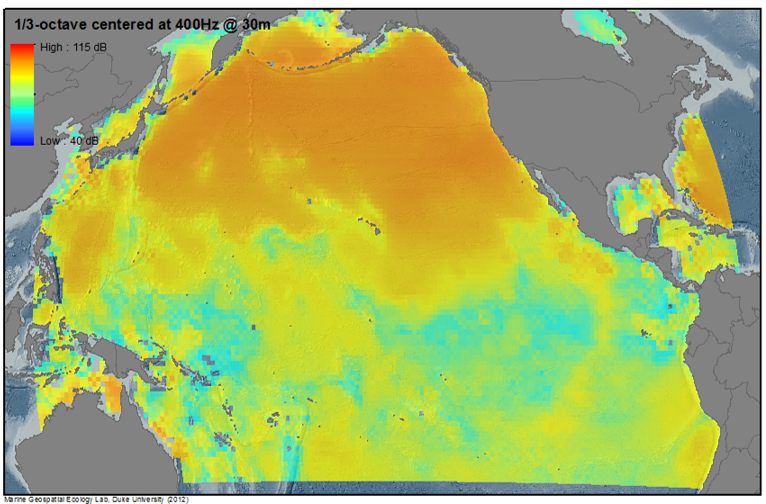
Long-term (e.g. annual) average predictions of noise levels from "chronic" anthropogenic sources of noise (e.g. cargo, passenger, fishing, and merchant shipping vessels, sustained areas of offshore energy exploration) were mapped coarsely across ocean basins (below) and in more detail through wide regions of the US EEZ (above).
Transient Acute Noise Producing Events

In addition, mapping efforts were conducted for a small number of localized and transient events that are more episodic or seasonal; these were selected to reflect major acute sources of human-produced noise in areas of biological importance to marine mammals, including: 1) a military active sonar training exercise in Hawai’i; 2) a period of seismic exploration in the Beaufort Sea; 3) the installation of an alternative energy platform off New England; and 4) the decommissioning of an oil platform in the Gulf of Mexico.
Example: Summed Noise Levels in the Gulf of Mexico
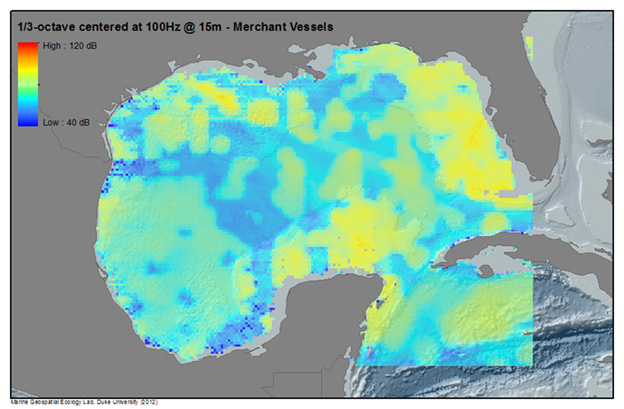
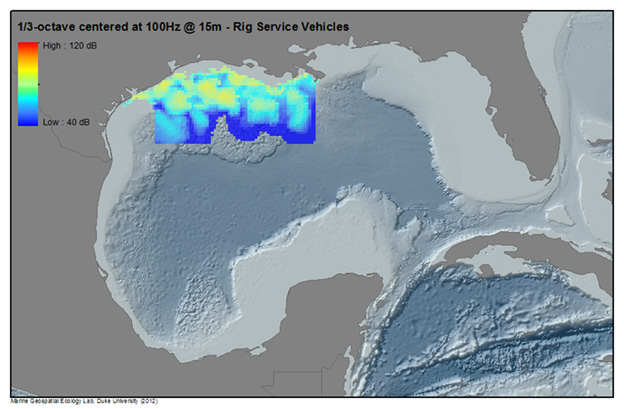
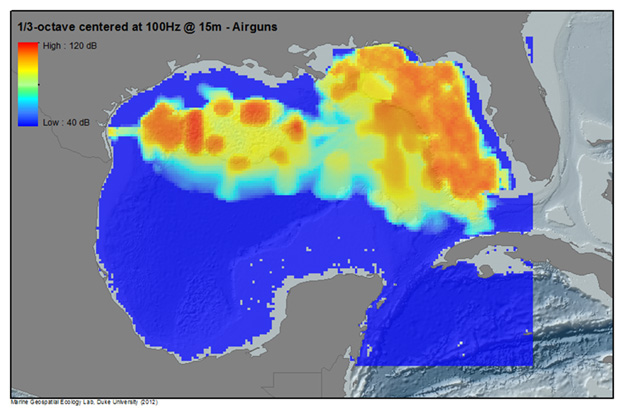
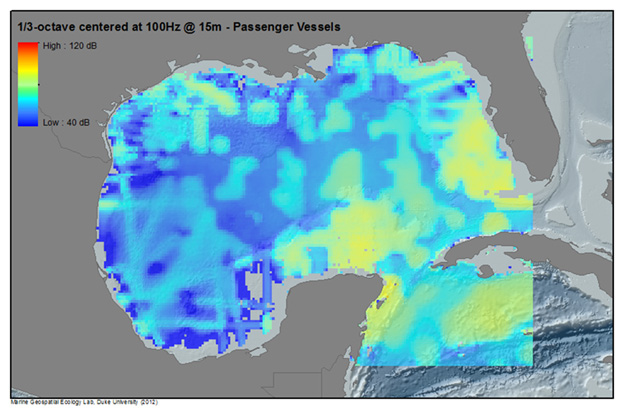
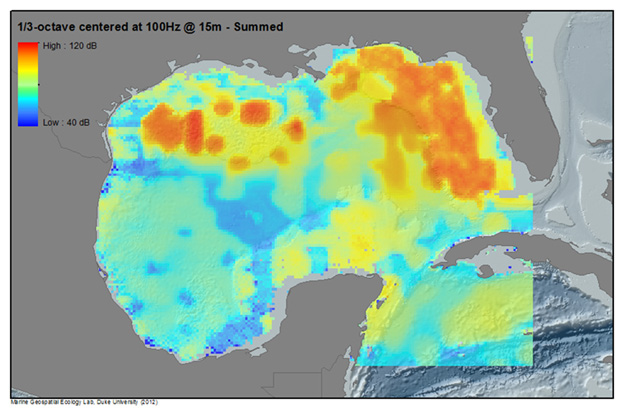
Below, noise from multiple human activities in the Gulf of Mexico are modeled to produce sound maps of anthropogenic noise for 2009 (Note- activity levels and patterns will change from year to year). Illustrated are modeled sound levels (1/3 octave band levels centered at 100Hz and15m depth) for Merchant Vessels, Rig Service Vessels, Seismic Surveys, Passenger Vessels, as well as a Summed sound field from all modeled sources. For more information on the methodology and results of the SoundMap effort, see the CetSound Symposium Final Report.

